December 2021
House music has the potential to change the amount of energy that’s built into its song. With the songs that are showcased, I will be presenting the amount of personal and audience energy that’s being present in each house song.
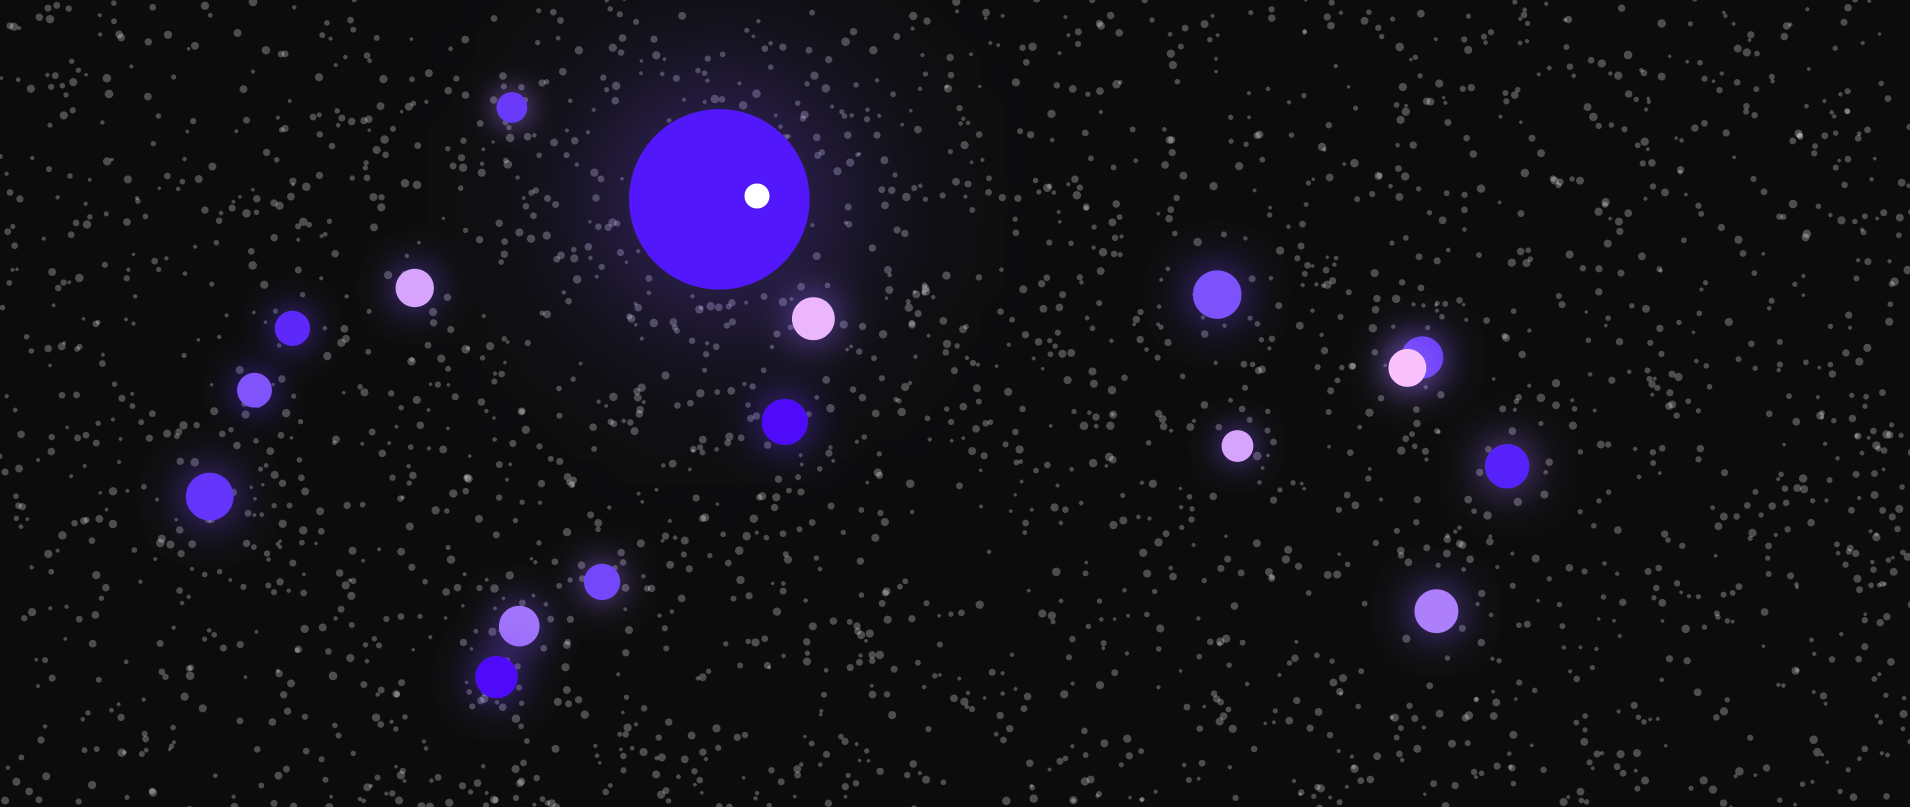
Users are able to select songs and view all of its details in a randomly generated map.
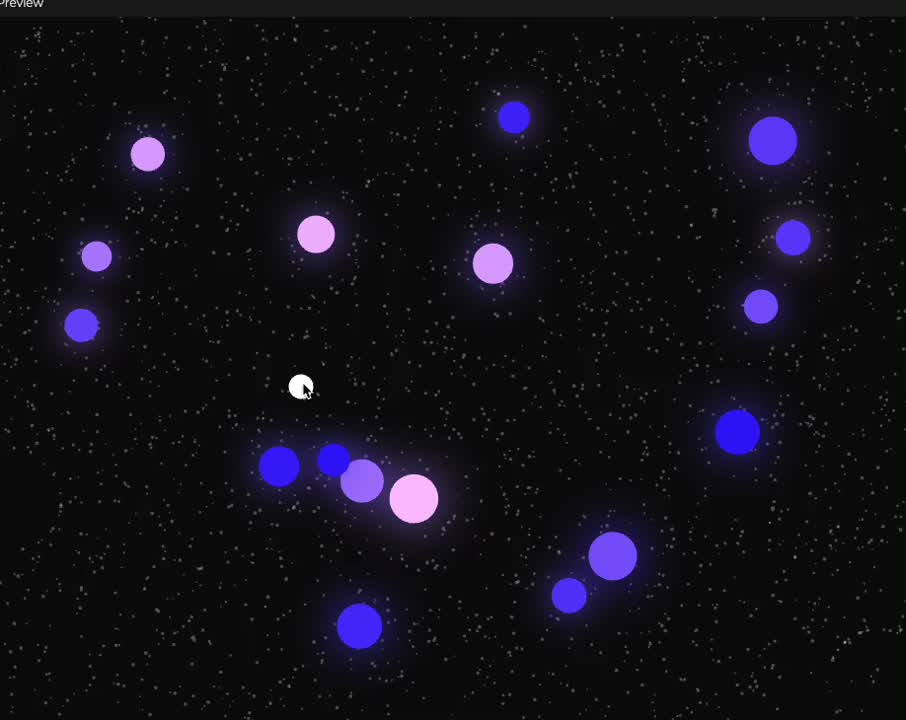
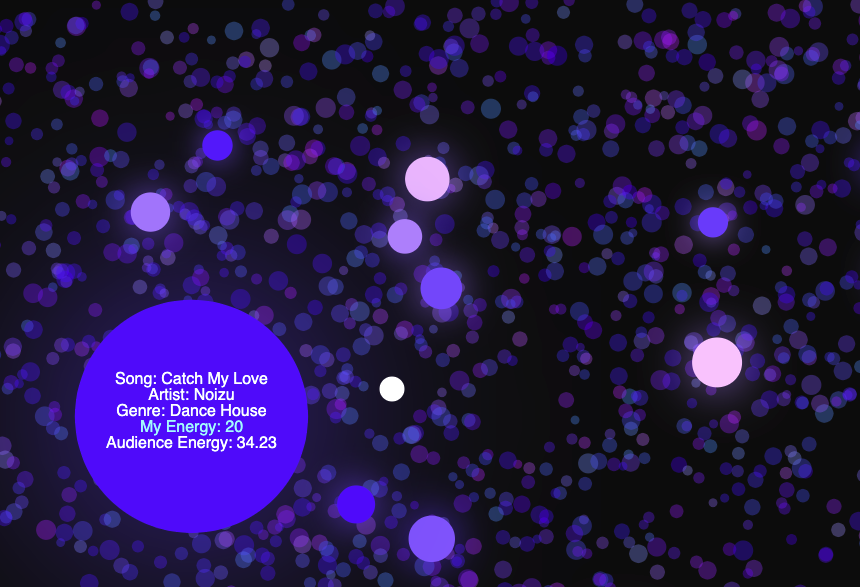
Elements in the map pulse along with the music's rhythm, creating a colorful and energetic visual aesthetic.
Users can view surveyed audience energies with a press of the spacebar, and compare their levels to mine.
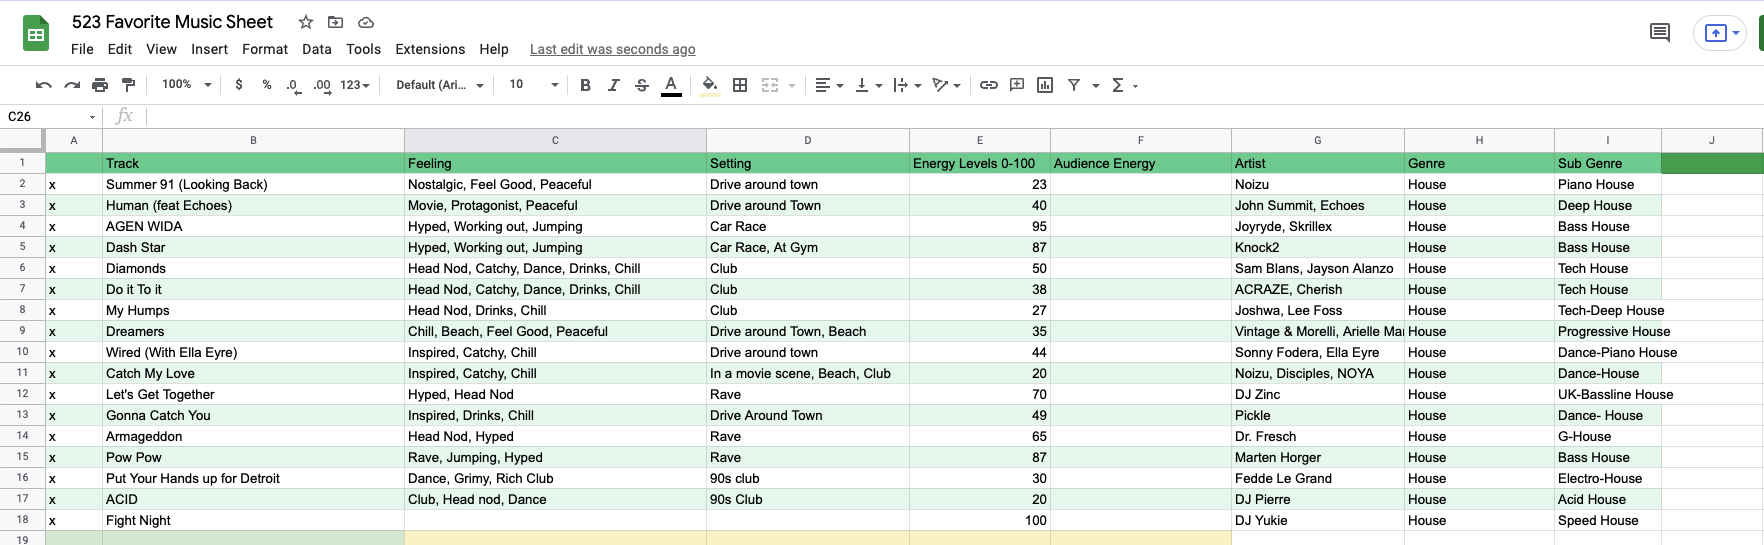
23 Diverse Participants were surveyed on their personal energy levels in 17 different songs.
Link to Part 1 of SurveyLink to Part 2 of Survey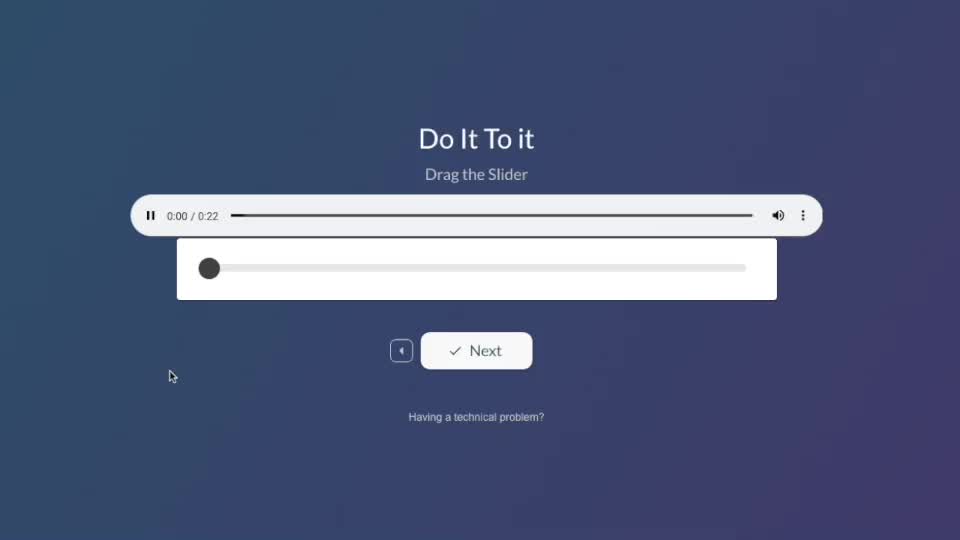
My initial sketches were aimed at visualizing music in an interactive field. The largest theme that was needed to be portrayed was energy. Movement and chaos was a motivator for the concepts, as it visually showed the drastic differences of house music.
To grasp a visual idea of the project's UI, a visualization was created to fully understand the implementations and ideation that was pictured. A fully interactive and clickable prototype was made on Figma to interpret the final product's system, movement, and concept.
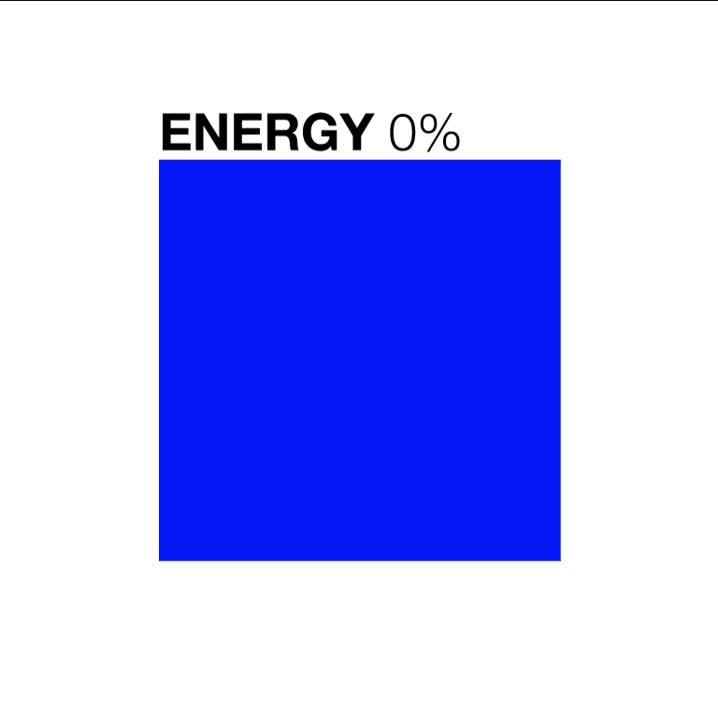
In order to functionally measure the amount of 'energy' in each song, each energy rating was calculated into a functional equation that changed the color based on the amount of energy in each song.
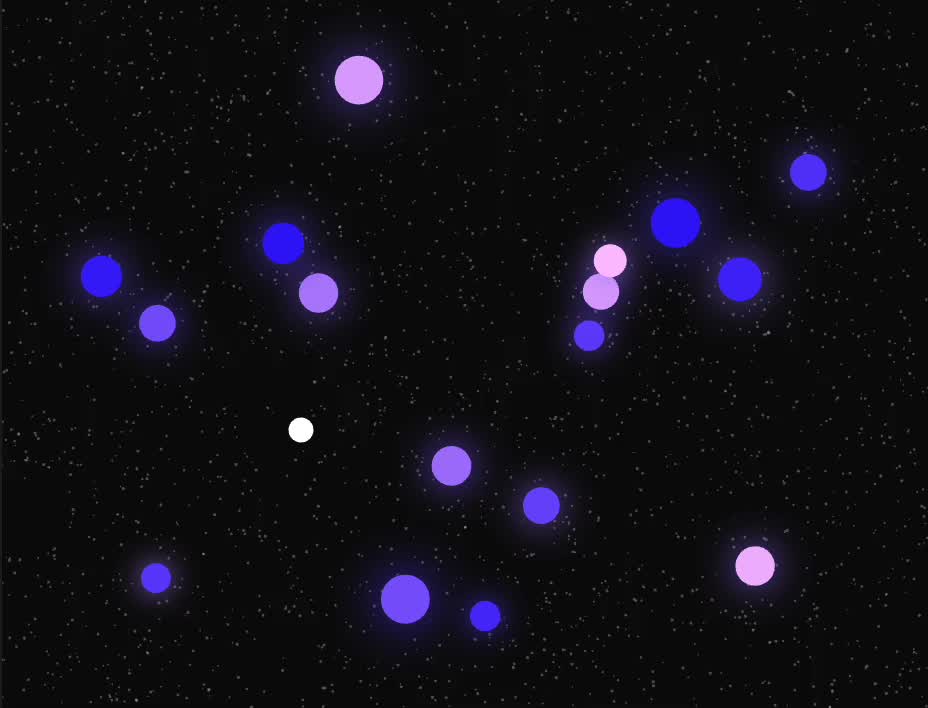
Functionality was the first step into making the composition. Class and objects were used to differentiate each individual circle with its song and details.
Link to First Working Prototype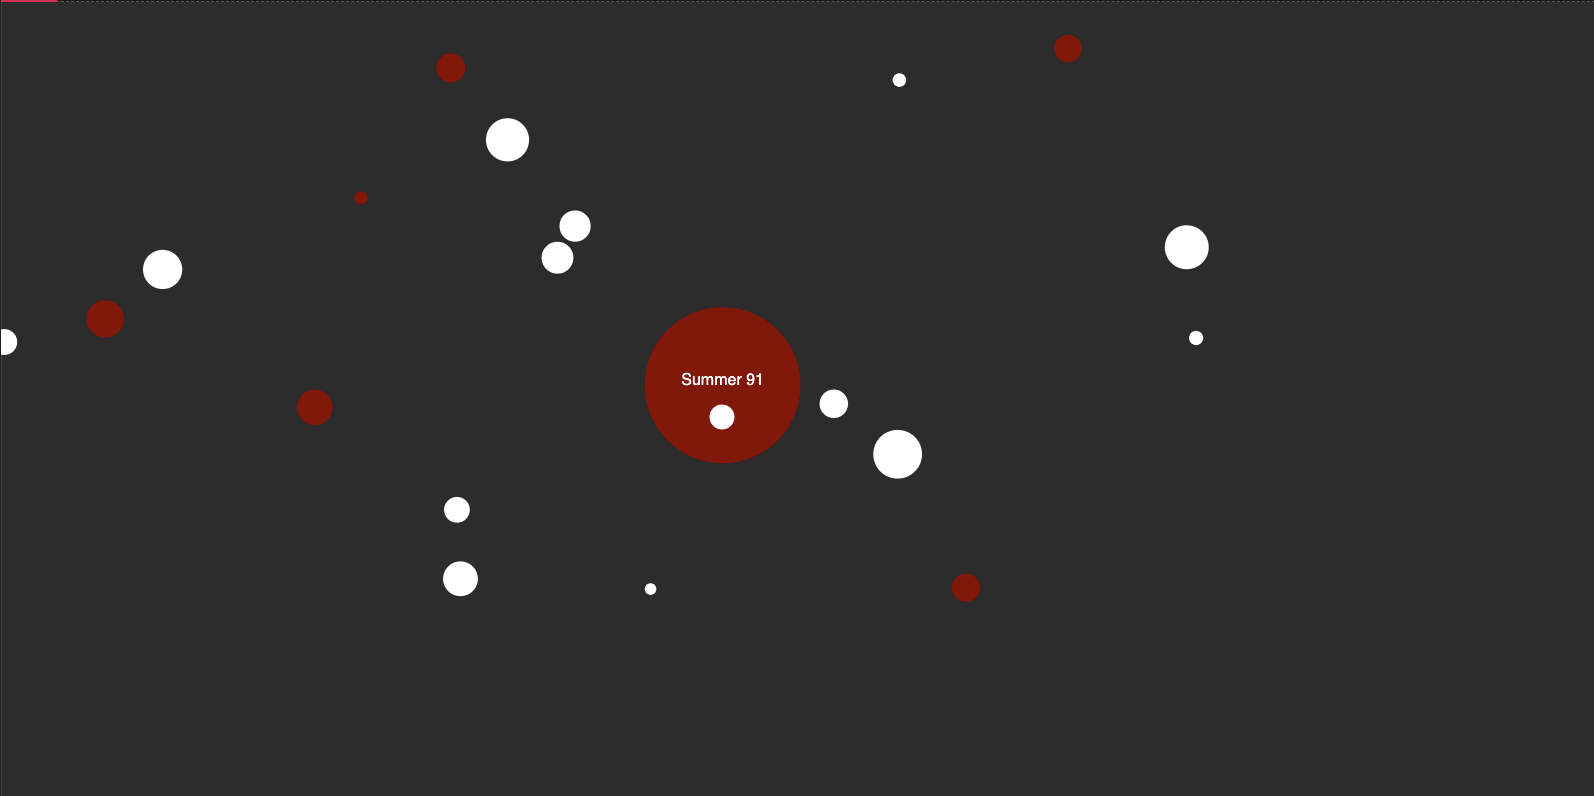
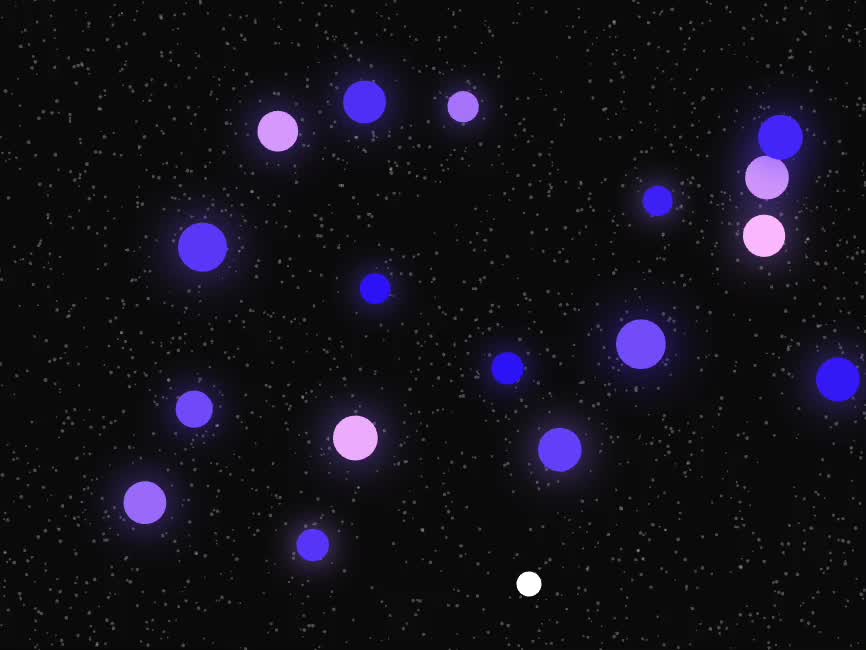
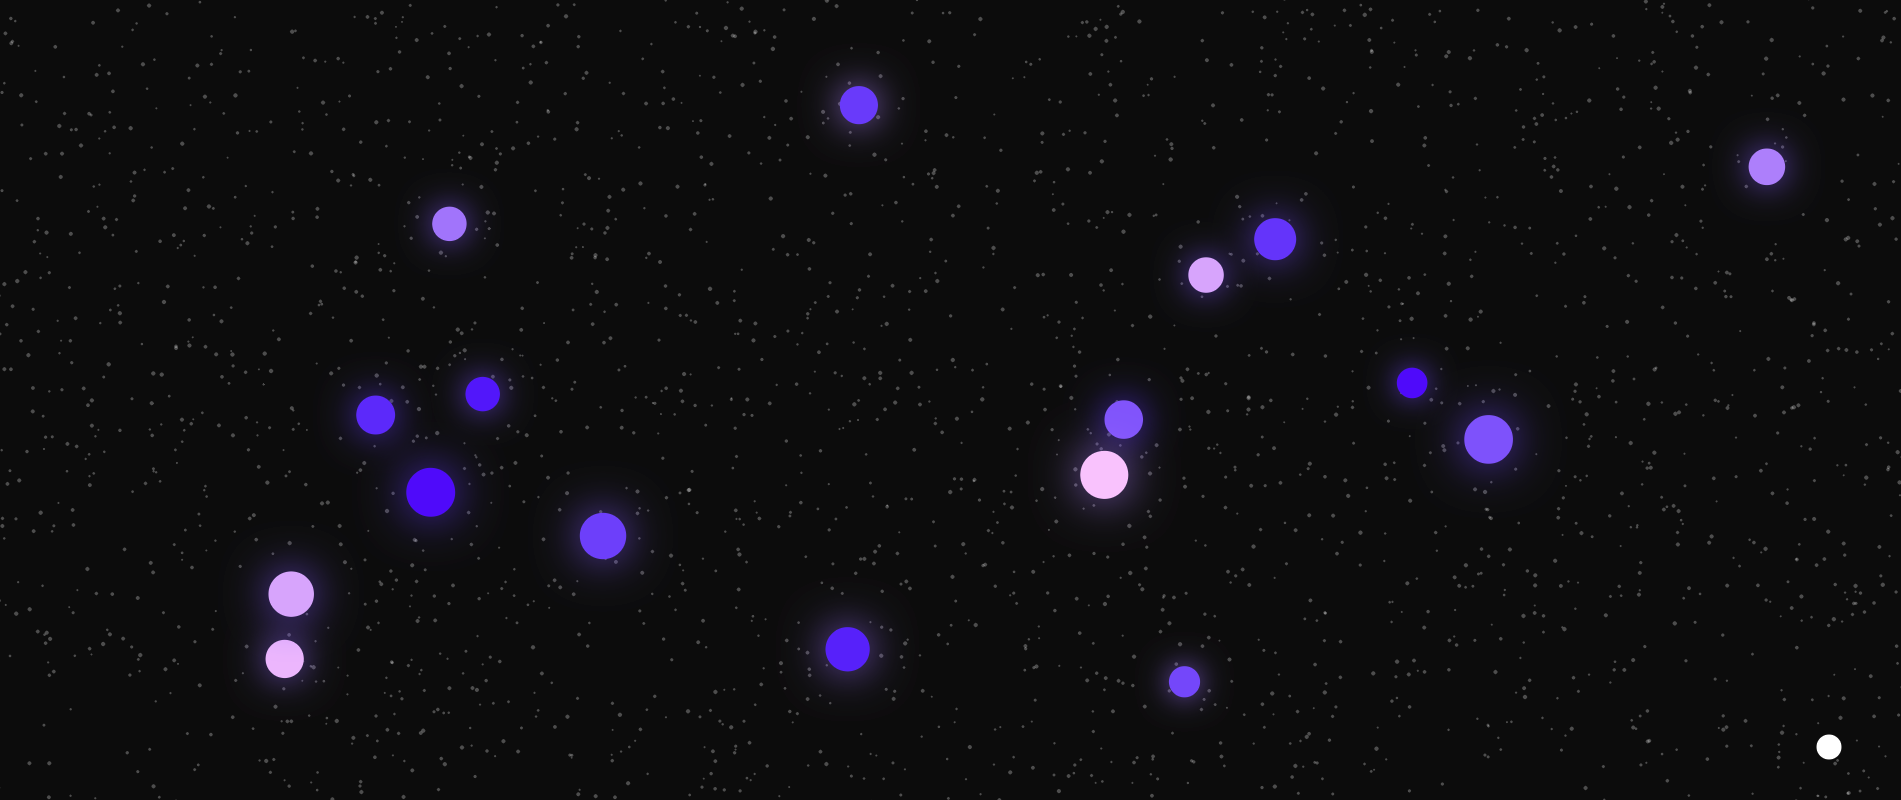
With the addition of more songs, more interactive aspects were also implemented in the second iteration.
Link to Second Working Prototype
Glow was implemented on the song circles to bring more attention to
its element.
I was required to cover all avenues of this design project. This allowed me to understand all avenues of the design process - from engineering constraints to user research. Going from start to finish also gave chance to take charge of the work, while also keeping limitations understandable for the engineering process. However, I had to learn a lot of Javascript work in order to make the design work. Although it was useful to understand the back ends of each project, I think that focusing more on the UX and UI work could've improved the project more.
